Table of Contents
Toggle200+ Wireshark Filters & Commands (2026): The Complete Packet Analysis Guide
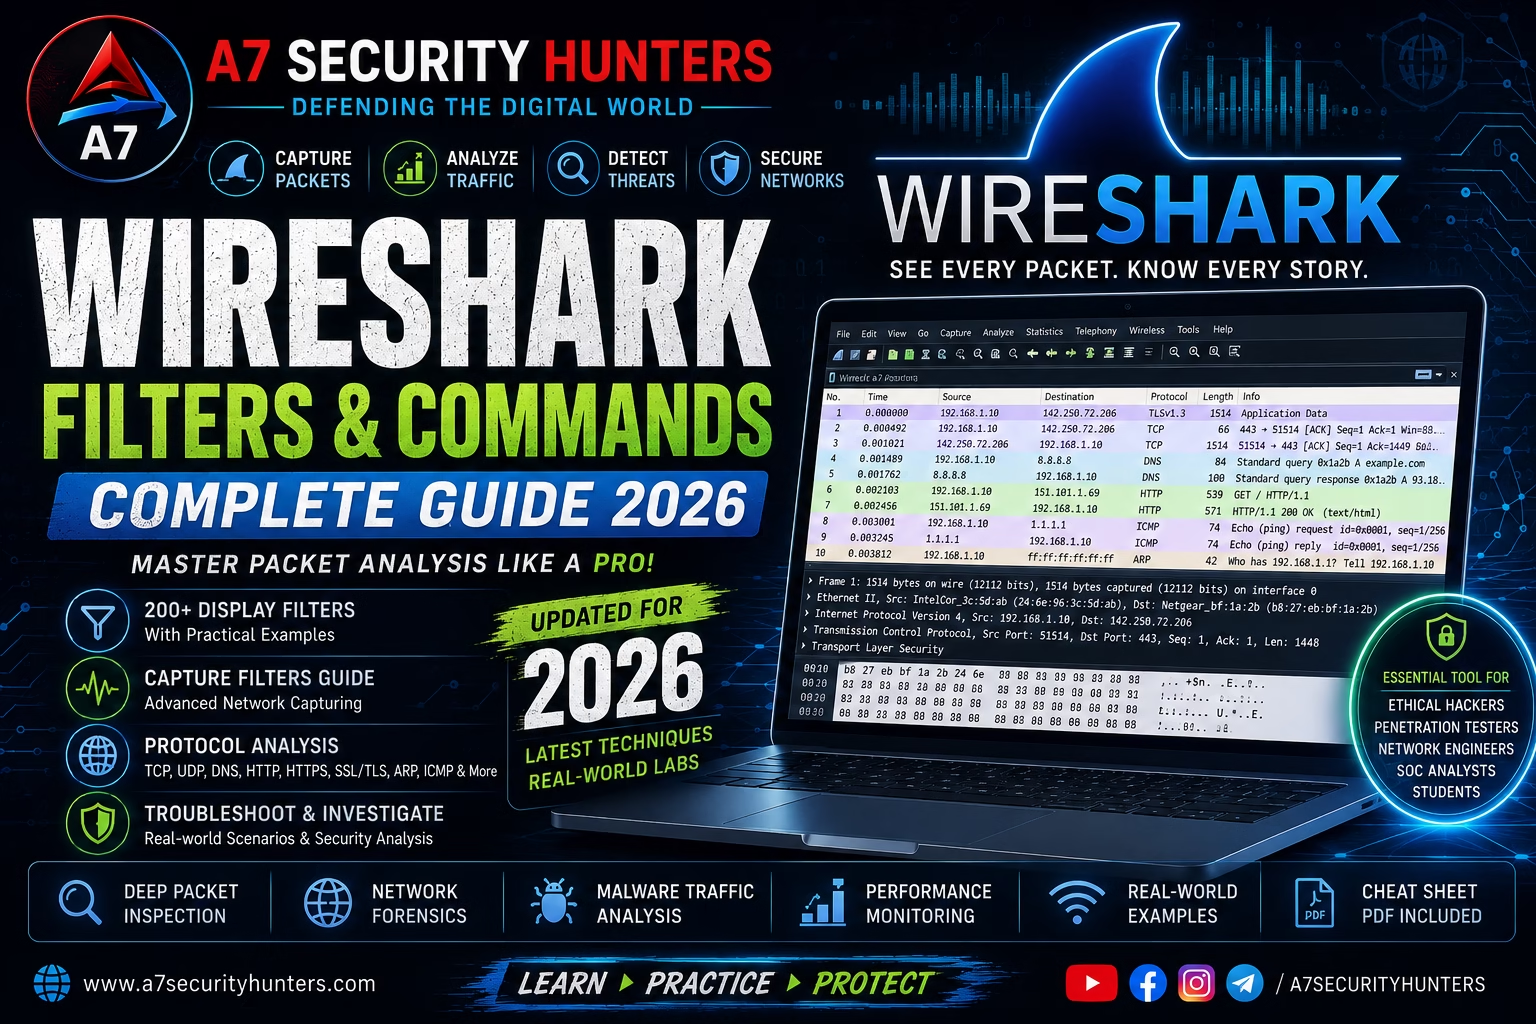
Master Wireshark from first capture to advanced analysis: capture filters (BPF), display filters, TCP/UDP/DNS/HTTP/TLS dissection, ARP and DHCP analysis, malware traffic analysis, network troubleshooting, and a full cheat sheet — with 200+ copy-paste filters, 50 FAQs, and hands-on labs for your own network.
200+ Filters50 FAQs20+ Tables4 LabsTShark⚡ 60-Second Summary
Wireshark is a free, open-source network protocol analyzer that captures and inspects network traffic in real time. Created by Gerald Combs in 1998 (originally as Ethereal), it decodes hundreds of protocols into readable fields so you can see exactly what flows across your network.
- Capture filters (BPF, applied before capture):
host 192.168.1.10ortcp port 443 - Display filters (applied to captured data):
ip.addr == 192.168.1.10orhttp.request - See conversations: right-click a packet → Follow TCP Stream
- Get files out of traffic: File → Export Objects → HTTP
- CLI twin:
tshark -r capture.pcap -Y "http"for scripting
Remember one workflow: capture with a tight capture filter → analyze with display filters → follow streams → check Statistics → document with screenshots. That loop solves most network questions.
Quick Answer: What Is Wireshark?
Wireshark is a network protocol analyzer that captures and analyzes network traffic in real time. It is widely used by network administrators, cybersecurity professionals, penetration testers, incident responders, and students to troubleshoot network issues, investigate security incidents, and understand how network protocols communicate.
Two filter types: capture filters use BPF syntax (tcp port 80) and apply during capture; display filters use Wireshark’s field syntax (tcp.port == 80) and filter already-captured packets.
Featured Snippet Answers
Short, extractable answers written to be quoted directly by Google, ChatGPT, Gemini, Claude, Perplexity, and Copilot.
Is Wireshark free?
Yes. Wireshark is free and open-source software (GPL-licensed) available for Windows, Linux, and macOS at wireshark.org. It includes the GUI, the TShark command-line tool, and hundreds of protocol dissectors at no cost.
Is Wireshark legal?
Yes — Wireshark is legal network-analysis software used by professionals worldwide. Legality depends on where you capture: capturing traffic on networks you own or administer (and your own devices) is standard practice; passive capture on networks you do not control may violate privacy laws and terms of service.
What is a packet in Wireshark?
A packet is a single unit of network data — a frame at the link layer wrapped around protocol headers and payload. Wireshark displays each captured packet in three panes: the packet list, the protocol details tree, and the raw bytes in hex.
What is the difference between capture filters and display filters?
Capture filters use Berkeley Packet Filter (BPF) syntax (tcp port 443) and discard non-matching packets at capture time. Display filters use Wireshark’s field-based syntax (tcp.port == 443) and only hide packets in the current view — nothing is deleted.
What is TShark?
TShark is Wireshark’s command-line companion. It captures and analyzes traffic without the GUI, supports the same display filters, and is ideal for scripts, automation, and remote servers: tshark -r file.pcap -Y "http.request".
Does Wireshark decrypt HTTPS?
Wireshark itself does not break encryption, but it can decrypt TLS traffic when you supply the session keys — typically via an SSLKEYLOGFILE produced by browsers or applications, or the server’s private key for RSA key exchange. TLS 1.3 sessions are decryptable only with key-log files.
1 · What Is Wireshark?
Wireshark puts raw network traffic under a microscope. It captures frames from a network interface (or reads them from a saved file), then decodes each frame through protocol dissectors — turning opaque bytes into readable trees: Ethernet → IP → TCP → HTTP → payload. The result is the definitive answer to “what is actually happening on my network?”
Key facts: first released in 1998 as Ethereal by Gerald Combs; renamed to Wireshark in 2006. It is GPL-licensed, runs on Windows, Linux, and macOS, and reads/writes more than 30 capture formats (pcap, pcapng, and others) so it can analyze files produced by tcpdump, Npcap, Wireshark itself, and many appliances.
Live capture
Real-time analysis of any interface, including Wi-Fi (with monitor-mode support where the adapter allows).
Deep dissection
2,000+ protocol dissectors decode everything from Ethernet to application payloads.
Powerful filters
BPF capture filters plus a field-based display-filter language with autocomplete.
Extensible
Lua scripting, custom dissectors, TShark for the CLI, and a full statistics toolkit.
2 · Why Use Wireshark?
Network troubleshooting
Latency, packet loss, retransmissions, and failed connections become visible facts instead of guesses. Wireshark’s Expert Info flags the anomalies automatically.
Security analysis
SOC analysts and incident responders examine suspicious traffic, extract malware artifacts, and trace attacker behavior — see the malware-analysis section below.
Protocol learning
There is no better way to learn TCP, DNS, HTTP, or TLS than watching the actual exchanges. Students see the handshake, the flags, and the sequence numbers live.
Penetration testing
Validating that a payload connected, confirming a reverse shell, or checking what a scanner actually sent — Wireshark is the evidence layer under every pentest.
Application debugging
Developers verify API calls, protocol implementations, and performance issues at the byte level.
Compliance & forensics
Packet captures are court-defensible evidence when collected properly — timestamped, hashed, and documented.
3 · Who Should Learn Wireshark?
| Role | Why Wireshark matters |
|---|---|
| Network administrators | Diagnose latency, drops, and misconfigurations on the wire |
| SOC analysts | Investigate alerts, confirm IoCs, extract artifacts from captures |
| Incident responders | Analyze pcap evidence of breaches and lateral movement |
| Penetration testers | Verify payload delivery, reverse shells, and scanner behavior |
| Students & trainees | See protocols actually working — the fastest way to internalize TCP/IP |
| Application developers | Debug APIs, protocols, and performance at packet level |
| Security researchers | Reverse-engineer protocols and analyze malware behavior |
4 · Features of Wireshark
- Live capture and offline analysis — capture directly or open saved pcap/pcapng files.
- Deep protocol inspection — 2,000+ dissectors across Ethernet, IP, TCP/UDP, and applications.
- Capture filters (BPF) — limit what gets recorded, reducing file size and noise.
- Display filters — a full field-based language with autocomplete, comparison, and regex operators.
- Coloring rules — color-code traffic by protocol, error, or conversation for instant scanning.
- Follow Stream — rebuild TCP/UDP/TLS streams as readable conversation views.
- Export Objects — extract files (images, documents, executables) transferred over HTTP/SMB.
- Statistics — protocol hierarchy, conversations, endpoints, IO graphs, and service-response times.
- Expert Info — automatic detection of retransmissions, duplicate ACKs, and other anomalies.
- TShark CLI — the same engine without the GUI, for scripts and servers.
- Lua scripting — custom dissectors, taps, and automation.
- Decryption support — TLS key-log files and IPsec keys for authorized analysis.
5 · Installing Wireshark
Windows
- Download the 64-bit installer from wireshark.org/download.html.
- Run the installer. When prompted, install Npcap — the capture driver Wireshark depends on. Keep “Start Npcap Service at boot” checked.
- Optionally check “Add Wireshark to PATH” for CLI tools like
tsharkandcapinfos.
Linux
sudo apt update && sudo apt install -y wireshark
# when asked about non-superuser capture, choose Yes
sudo usermod -aG wireshark $USER
# log out and back in for the group to take effect
sudo dnf install -y wireshark-cli wireshark
macOS
brew install --cask wireshark
Verify the Installation
wireshark --version
tshark --version
tshark -D          # list capture interfaces
Installation Troubleshooting
| Symptom | Cause | Fix |
|---|---|---|
| “There are no interfaces on which a capture can be done” | No capture driver or permissions | Windows: install Npcap. Linux: add user to wireshark group |
| Capture starts but zero packets | Wrong interface or VM networking | Pick the correct NIC; in VMs use bridged mode or capture on the host |
tshark: command not found | CLI tools not on PATH | Windows: reinstall with PATH option. Linux: install wireshark-cli |
| No Wi-Fi packets in monitor mode | Adapter or OS restrictions | Only some adapters support monitor mode; use an external adapter (e.g., Alfa) in labs |
| GUI opens but capture fails | Npcap service stopped | Windows: start “Npcap” service in services.msc |
| Huge capture files fill the disk | No capture filter, no ring buffer | Use capture filters + multiple files (ring buffer) in Capture Options |
6 · Understanding the Interface
Wireshark’s main window is built around three panes, all driven by a single selected packet:
- Packet List pane (top): one row per packet — number, time, source, destination, protocol, length, and info. Click a row to inspect it.
- Packet Details pane (middle): the decoded protocol tree: Frame → Ethernet → IP → TCP → application. Expand any field; field names here are the basis of display filters.
- Packet Bytes pane (bottom): the raw packet in hex and ASCII. Clicking bytes highlights the corresponding decoded field.
Key interface elements: the filter toolbar (with a green/red background indicating valid/invalid display filters), the main toolbar (start/stop capture, open/save), the status bar (capture stats), and Expert Info (the color-coded warning icon in the status bar). Coloring rules tint packets (e.g., black = TCP problems, red = bad TCP) so anomalies jump out visually.
7 · Capture Filters (BPF Syntax)
Capture filters run inside the capture driver and discard non-matching packets before they reach Wireshark. They use Berkeley Packet Filter (BPF) syntax — the same language as tcpdump. Use them to control volume; use display filters for analysis.
| Capture Filter (BPF) | What it captures |
|---|---|
host 192.168.1.10 | Traffic to/from one host |
src host 192.168.1.10 | Traffic from one host only |
dst host 192.168.1.10 | Traffic to one host only |
net 192.168.1.0/24 | Traffic to/from a subnet |
port 80 | Traffic on port 80 (any protocol) |
tcp port 443 | TCP traffic on port 443 |
udp port 53 | UDP traffic on port 53 (DNS) |
portrange 8000-9000 | Traffic on a port range |
icmp | All ICMP traffic (ping, errors) |
arp | All ARP traffic |
tcp / udp | All TCP / all UDP traffic |
not arp | Everything except ARP (reduces local noise) |
port 80 or port 443 | HTTP or HTTPS traffic |
tcp and not port 22 | All TCP except SSH |
host 10.0.0.5 and tcp port 445 | Combined host + port |
tcp[tcpflags] & (tcp-syn) != 0 | Only TCP SYN packets (handshake starts) |
vlan 100 | Traffic in VLAN 100 |
ether host aa:bb:cc:dd:ee:ff | Traffic to/from a MAC address |
ip6 | All IPv6 traffic |
tcp.port == 80) into the capture-filter box. BPF syntax uses port 80, not tcp.port == 80 — the capture-filter box rejects display-filter syntax with an error dialog.8 · Display Filters (Field-Based Syntax)
Display filters operate on already-captured packets and only change what you see — nothing is deleted. They reference protocol fields by name (exactly as shown in the Packet Details pane) and support comparison, logical, and regex operators.
Operators
| Operator | Meaning | Example |
|---|---|---|
== | Equals | ip.src == 192.168.1.10 |
!= | Not equal | ip.src != 192.168.1.1 |
> < >= <= | Comparison (numbers) | frame.len > 1000 |
contains | Substring match | frame contains "password" |
matches | Regex match (PCRE) | http.host matches "\.(com|net)$" |
in | Membership in a set | tcp.port in {80,443,8080} |
and / && | Logical AND | tcp.port == 443 and ip.addr == 10.0.0.5 |
or / || | Logical OR | dns or mdns |
not / ! | Logical NOT | not arp |
( ) | Grouping | (tcp.port == 80 or tcp.port == 443) and ip.src == 10.0.0.0/24 |
Essential Display Filters
| Display Filter | What it shows |
|---|---|
ip.addr == 192.168.1.10 | Any traffic involving that IP (either direction) |
ip.src == 192.168.1.10 | Traffic from that IP |
ip.dst == 192.168.1.10 | Traffic to that IP |
tcp.port == 443 | Traffic on port 443 (either direction) |
tcp.flags.syn == 1 | SYN packets (connection attempts) |
tcp.flags.reset == 1 | RST packets (refused/aborted connections) |
http | All HTTP packets |
http.request | HTTP requests only |
http.response | HTTP responses only |
dns | All DNS traffic |
dns.flags.response == 0 | DNS queries only |
dns.flags.response == 1 | DNS responses only |
icmp | All ICMP traffic |
arp | All ARP traffic |
dhcp (or bootp) | All DHCP traffic |
tls (or ssl) | All TLS/SSL traffic |
tcp.analysis.retransmission | TCP retransmissions (packet loss indicator) |
tcp.analysis.duplicate_ack | Duplicate ACKs |
tcp.analysis.zero_window | Receiver buffer full (backpressure) |
frame contains "GET /" | Any packet containing that byte sequence |
frame.len > 1400 | Large (likely full-MTU) packets |
udp.port == 53 | UDP DNS traffic |
ip.version == 6 | IPv6 only |
eth.addr == aa:bb:cc:dd:ee:ff | Traffic to/from a MAC |
http.response.code == 404 | HTTP 404 responses |
tcp.analysis.flags | Any packet flagged by TCP analysis |
tcp. in the filter box and Wireshark lists every field. Field names come from the dissectors and are shown in the Details pane — the filter box color turns green when your syntax is valid.9 · TCP Analysis
TCP is the protocol you will analyze most. Start with the three-way handshake, then learn to read the analysis flags Wireshark computes automatically.
The Three-Way Handshake in Wireshark
tcp.flags.syn == 1
Look for the [SYN], [SYN, ACK], [ACK] sequence in the Info column. A [RST, ACK] instead of [SYN, ACK] means the port is closed; silence means filtered.
TCP Analysis Flags (Expert Info)
| Filter | Meaning | Typical cause |
|---|---|---|
tcp.analysis.retransmission | Same segment sent again | Packet loss, network congestion |
tcp.analysis.fast_retransmission | Retransmission triggered by duplicate ACKs | Loss without timeout |
tcp.analysis.duplicate_ack | ACK for already-acked data | Out-of-order or lost segment |
tcp.analysis.zero_window | Receiver advertises 0 window | Application not reading fast enough |
tcp.analysis.window_update | Window size increased | Receiver recovered |
tcp.analysis.ack_lost_segment | ACK references a missing segment | Loss detected by receiver |
tcp.analysis.out-of-order | Segment arrived out of sequence | Path changes or load balancing |
tcp.analysis.keep_alive | Keep-alive probe | Idle connection check |
tcp.analysis.flags | Any of the above | Quick anomaly sweep |
10 · UDP Analysis
UDP is connectionless — no handshake, no sequence numbers, no retransmissions. Analysis is simpler: source/destination port, length, and payload. Wireshark still flags anomalies where it can (e.g., IP fragmentation, checksum errors).
| Filter | What it shows |
|---|---|
udp | All UDP traffic |
udp.port == 53 | UDP DNS |
udp.port == 123 | NTP |
udp.port == 161 | SNMP |
udp.port == 67 or udp.port == 68 | DHCP client/server |
udp.length > 1000 | Large UDP datagrams |
udp.checksum.status == 0 | UDP checksum errors |
Common UDP issues: packet loss is invisible to the protocol itself (applications detect it), and firewalls often drop UDP silently. When a UDP service “doesn’t work”, Wireshark answers the first question: did the request even leave the client, and did any response come back?
11 · DNS Analysis
DNS maps names to addresses and is involved in nearly every connection — which makes it a goldmine for troubleshooting and security analysis (C2 domains, DNS tunneling, phishing).
| Filter | What it shows |
|---|---|
dns | All DNS traffic |
dns.flags.response == 0 | DNS queries |
dns.flags.response == 1 | DNS responses |
dns.qry.name == "example.com" | Queries for a specific name |
dns.qry.name contains "admin" | Queries whose name contains a string |
dns.flags.rcode == 3 | NXDOMAIN responses (name not found) |
dns.a | Responses containing A records |
dns.resp.type == 5 | CNAME responses |
dns.qry.type == 28 | AAAA (IPv6) queries |
dns.count.answers > 0 | Responses with answers |
dns.qry.name matches "\.(exe|zip|ps1)$" | Queries for suspicious file-like names |
Statistics → DNS → display the query-name table
Troubleshooting pattern: query sent but no response → DNS server unreachable or UDP 53 blocked; NXDOMAIN → name genuinely doesn’t exist (typo or missing record); SERVFAIL → server-side problem; wrong IP returned → stale cache or DNS hijacking.
12 · HTTP & HTTPS Analysis
HTTP is the easiest protocol to read in Wireshark — requests and responses are human-readable, and the analysis tools are excellent.
HTTP Display Filters
| Filter | What it shows |
|---|---|
http | All HTTP packets |
http.request | HTTP requests |
http.response | HTTP responses |
http.request.method == "GET" | GET requests |
http.request.method == "POST" | POST requests (form/API submissions) |
http.host == "example.com" | Requests for a specific host |
http.response.code == 404 | 404 responses |
http.response.code >= 500 | Server errors |
http.user_agent | Requests with a User-Agent header |
http.request.uri contains "login" | Requests hitting login paths |
http.content_type == "text/html" | HTML responses |
http.authorization | Requests carrying Basic auth (base64) |
Follow Stream & Export Objects
Right-click any HTTP packet → Follow → TCP Stream
File → Export Objects → HTTP → select files → Save
HTTPS: TLS encrypts the payload, so you see the handshake and metadata (Server Name Indication, certificates, cipher suites) but not the content — unless you supply decryption keys (see the TLS section). For web-app testing of decrypted traffic, pair Wireshark with Burp Suite: configure Burp as the proxy and capture from Wireshark at the same time.
13 · ICMP Analysis
ICMP carries ping (echo), errors, and path information. It is the first protocol to check when a host “isn’t reachable”.
| Filter | What it shows |
|---|---|
icmp | All ICMP traffic |
icmp.type == 8 | Echo requests (ping sent) |
icmp.type == 0 | Echo replies (ping answered) |
icmp.type == 3 | Destination unreachable |
icmp.type == 11 | Time exceeded (TTL — traceroute) |
icmp.type == 5 | Redirect messages |
icmp.checksum.status == 0 | Bad ICMP checksums |
icmp.seq == 1 | Specific sequence number |
Troubleshooting pattern: requests sent but no replies → firewall blocks ICMP or host is down; replies with long RTT → latency; Destination unreachable (Port unreachable) → a UDP port is closed (useful cross-check for Nmap UDP results); Time exceeded → TTL too small or routing loop.
14 · ARP Analysis
ARP maps IPv4 addresses to MAC addresses on local networks. It is broadcast-based, unauthenticated — and therefore a favorite target for attackers (ARP spoofing/poisoning).
| Filter | What it shows |
|---|---|
arp | All ARP traffic |
arp.opcode == 1 | ARP requests (“who has X?”) |
arp.opcode == 2 | ARP replies (“X is at MAC”) |
arp.src.proto_ipv4 == 192.168.1.10 | ARP from a specific IP |
arp.isgratuitous == 1 | Gratuitous ARP (unsolicited announcements) |
arp.duplicate-address-detected | Two hosts claim the same IP |
arp.hw.size == 6 | Standard MAC-size ARP |
Security pattern — ARP spoofing: one IP address answered by many different MACs over time, or a flood of gratuitous ARP replies, indicates poisoning. In a lab, run arpspoof (from dsniff) and watch the victim’s ARP cache change — then examine the same evidence in Wireshark to learn what the attack looks like on the wire.
15 · DHCP Analysis
DHCP (Dynamic Host Configuration Protocol) assigns IP configuration automatically. The DORA exchange — Discover, Offer, Request, Acknowledge — is easy to follow in Wireshark.
| Filter | What it shows |
|---|---|
dhcp / bootp | All DHCP traffic (older versions use bootp) |
dhcp.option.dhcp == 1 | DHCP Discover |
dhcp.option.dhcp == 2 | DHCP Offer |
dhcp.option.dhcp == 3 | DHCP Request |
dhcp.option.dhcp == 5 | DHCP ACK |
dhcp.option.hostname | Client hostname option |
dhcp.option.router | Offered default gateway |
dhcp.option.domain_name_server | Offered DNS servers |
dhcp.option.requested_ip_address | Client asking for a specific IP |
dhcp.option.lease_time | Lease duration |
Troubleshooting pattern: Discover sent but no Offer → no reachable DHCP server (check VLANs/relays); repeated Requests → lease conflicts or server misconfiguration; a rogue DHCP server is identifiable because two servers answer with different Offers — filter by dhcp.option.dhcp == 2 and inspect the sender IPs.
16 · SSL/TLS Analysis
TLS secures HTTPS, SMTP, IMAP, and most modern APIs. In Wireshark you can see the handshake, cipher suites, certificates, and SNI — and with key material, decrypt the session (authorized analysis only).
TLS Handshake & Metadata Filters
| Filter | What it shows |
|---|---|
tls (older: ssl) | All TLS traffic |
tls.handshake.type == 1 | ClientHello |
tls.handshake.type == 2 | ServerHello |
tls.handshake.type == 11 | Certificate |
tls.handshake.extensions.server_name | SNI — the hostname requested (visible even in TLS 1.3) |
tls.record.version == 0x0303 | TLS 1.2 records |
tls.record.version == 0x0304 | TLS 1.3 records |
tls.handshake.ciphersuite == 0x1301 | TLS_AES_128_GCM_SHA256 (TLS 1.3) |
tls.handshake.certificate | Packets carrying certificates |
tls.alert | TLS alerts (handshake failures, fatal errors) |
Decrypting TLS with a Key Log File (Authorized Analysis)
- Set the environment variable
SSLKEYLOGFILE=/path/keys.logbefore launching the browser or application you want to decrypt (Firefox and Chrome both support it). - In Wireshark: Edit → Preferences → Protocols → TLS → set (Pre)-Master-Secret log filename to that file.
- Capture (or open the pcap) and Wireshark decrypts the sessions recorded in the log.
17 · Malware Traffic Analysis
Malware must communicate: with a C2 server, to exfiltrate data, or to scan the network. That communication is evidence. A structured hunt turns a pcap into indicators.
The A7 Malware-Traffic Hunt Checklist
- Start with the outliers:
tcp.analysis.flags or dns.flags.rcode == 3— errors and failed lookups point to beaconing and dead C2s. - List every DNS name: Statistics → DNS. Look for long random subdomains, new domains, or patterns matching a regex.
- Find unusual ports:
tcp.port in {4444,5555,8080,9001}then Statistics → Endpoints to see uncommon pairs. - Follow suspicious streams: right-click → Follow TCP Stream; look for binary blobs, encoded commands, or IRC-like chatter.
- Extract files: File → Export Objects (HTTP, SMB, TFTP) — then hash them and check VirusTotal.
- Check for common C2 strings:
frame contains "cmd",http.request.uri contains "shell",frame contains "powershell". - Geo-locate: enable MaxMind GeoIP (Preferences → Name Resolution) to see where endpoints resolve.
- Document: screenshot each finding with its filter string, timestamp, and IPs.
| Filter | What it surfaces |
|---|---|
dns.qry.name matches "([a-z0-9]{20,})\.(com|net|top|xyz)$" | Long random subdomains — classic DGA pattern |
dns.flags.rcode == 3 | NXDOMAIN — failed C2 resolution |
http.request.uri contains "upload" | Potential exfiltration endpoints |
http.user_agent contains "curl" | Non-browser HTTP clients (automation) |
frame contains "powershell" | PowerShell in payloads |
frame contains "cmd.exe" | Command execution artifacts |
tcp.port == 4444 or tcp.port == 6667 | Common C2/IRC ports |
tls.handshake.extensions.server_name contains "cloudfront" | C2 hiding behind CDNs |
icmp and frame.len > 100 | Large ICMP — possible tunneling |
18 · Troubleshooting Networks with Wireshark
A systematic method beats random clicking. For every “the network is slow” report, run this sequence:
- Capture at the right point — on the affected client, with a capture filter (
host <server>) to keep the file small. - Check Expert Info — Analyze → Expert Info; fix the errors first, then look at warnings.
- Quantify retransmissions — filter
tcp.analysis.retransmission; count them and check the IO Graph for the rate over time. - Measure latency — filter
tcp.analysis.ack_rttto see per-segment round-trip times. - Check the window —
tcp.analysis.zero_windowtells you if the receiver is the bottleneck. - Confirm the handshake —
tcp.flags.syn == 1: if SYN gets no SYN-ACK, the server or a firewall is dropping it. - Document — save a filtered view (File → Export Specified Packets) and a screenshot with the filter string visible.
| Symptom | First filter to try | What it tells you |
|---|---|---|
| Site loads slowly | tcp.analysis.retransmission | Packet loss on the path |
| Connection hangs | tcp.flags.syn == 1 | Where the handshake stops |
| Downloads stall | tcp.analysis.zero_window | Receiver or application buffer full |
| DNS failures | dns.flags.rcode | NXDOMAIN vs SERVFAIL vs timeout |
| “No internet” | icmp.type == 8 or dns | Is the gateway reachable? Does DNS resolve? |
| Random disconnects | tcp.flags.reset == 1 | Who sends RST — client, server, or middlebox |
| Voice/video jitter | rtp and Statistics → RTP | Packet loss and jitter per stream |
19 · Common Errors and How to Fix Them
| Error / Symptom | Cause | Fix |
|---|---|---|
| Filter box turns red | Invalid display-filter syntax | Use autocomplete; check quotes around strings ("GET") |
| “No interfaces found” | Driver/permission problem | Install Npcap; add user to wireshark group |
| Capture filter rejected | BPF syntax error | Remember: tcp port 80, not tcp.port == 80 |
| Promiscuous mode off | Adapter or VM setting | Enable promiscuous mode; VM NICs need host-side capture |
| File too large to open | Multi-GB captures | Re-capture with filters; use ring buffers; editcap to trim |
| TLS shows only “Application Data” | No decryption keys | Configure SSLKEYLOGFILE; check TLS version support |
| Duplicated packets | Multiple interfaces captured | Capture one interface; use not (vlan or mpls) where needed |
| Timestamps look wrong | Display format/UTC setting | View → Time Display Format → set Seconds Since Epoch or UTC |
| Can’t see HTTP on 8080 | Port not registered as HTTP | Edit → Preferences → Protocols → HTTP → TCP port 8080 |
| tshark output empty | Wrong -Y filter or read filter | Test the display filter in the GUI first |
| Checksum errors everywhere | Offload (TCP checksum offloading) — often benign | Preferences → Protocols → TCP → disable checksum validation |
20 · Best Practices for Packet Analysis
✔ Always
- Capture with a tight capture filter; analyze with display filters
- Use multiple files / ring buffers for long captures
- Name captures descriptively (
client1-to-app-2026-08-07.pcapng) - Document every finding with filter string + screenshot
- Check Expert Info early — it finds what you didn’t think to look for
- Redact sensitive payloads before sharing captures
- Verify capture point: switch port, SPAN port, or tap for full visibility
✘ Avoid
- Capturing without any filter on busy links (multi-GB files)
- Trusting checksum errors on offloading NICs
- Sharing pcaps with passwords, tokens, or PII in cleartext
- Capturing traffic you aren’t authorized to inspect
- Analyzing on the capture machine during heavy traffic (drop risk)
- Ignoring timestamps — set a reliable clock source first
21 · Wireshark vs tcpdump (and TShark)
| Feature | Wireshark | tcpdump | TShark |
|---|---|---|---|
| Interface | Graphical (3-pane) | Command line | Command line |
| Capture engine | Npcap / libpcap | libpcap | Npcap / libpcap |
| Capture filters | BPF | BPF | BPF |
| Display filters | Yes (GUI) | No (only BPF) | Yes (-Y) |
| Protocol dissection | Deep (2,000+ dissectors) | Basic | Deep (same engine) |
| Best for | Interactive analysis, learning, forensics | Quick CLI capture on servers | Scripts, automation, remote analysis |
When to use which: tcpdump is the right tool on a headless server or embedded device (tcpdump -i eth0 -w capture.pcap); Wireshark is the right tool for deep analysis afterward. TShark bridges both — capture with tcpdump, analyze with tshark -r, and open the same file in the GUI when you need visuals.
tcpdump -i eth0 -w capture.pcap "tcp port 443"   # capture
tshark -r capture.pcap -Y "tls.handshake.type == 1" -T fields -e tls.handshake.extensions.server_name
22 · Wireshark Cheat Sheet (Top 50 Quick Filters)
| Goal | Display Filter |
|---|---|
| All traffic to/from an IP | ip.addr == 192.168.1.10 |
| Traffic from an IP | ip.src == 192.168.1.10 |
| Traffic to an IP | ip.dst == 192.168.1.10 |
| Subnet traffic | ip.addr == 192.168.1.0/24 |
| Port (either direction) | tcp.port == 443 |
| Any of several ports | tcp.port in {80,443,8080} |
| SYN packets | tcp.flags.syn == 1 |
| RST packets | tcp.flags.reset == 1 |
| Retransmissions | tcp.analysis.retransmission |
| Duplicate ACKs | tcp.analysis.duplicate_ack |
| Zero window | tcp.analysis.zero_window |
| Any TCP anomaly | tcp.analysis.flags |
| All HTTP | http |
| HTTP requests | http.request |
| HTTP POST | http.request.method == "POST" |
| HTTP errors | http.response.code >= 400 |
| Specific host | http.host == "example.com" |
| URI contains string | http.request.uri contains "admin" |
| All DNS | dns |
| DNS queries | dns.flags.response == 0 |
| DNS responses | dns.flags.response == 1 |
| DNS for a name | dns.qry.name == "example.com" |
| NXDOMAIN | dns.flags.rcode == 3 |
| All TLS | tls |
| ClientHello | tls.handshake.type == 1 |
| Certificates | tls.handshake.type == 11 |
| SNI hostnames | tls.handshake.extensions.server_name |
| TLS alerts | tls.alert |
| All ICMP | icmp |
| Ping request/reply | icmp.type == 8 or icmp.type == 0 |
| Unreachable | icmp.type == 3 |
| All ARP | arp |
| ARP requests | arp.opcode == 1 |
| Gratuitous ARP | arp.isgratuitous == 1 |
| All DHCP | dhcp |
| DHCP Discover | dhcp.option.dhcp == 1 |
| DHCP ACK | dhcp.option.dhcp == 5 |
| All UDP | udp |
| UDP DNS | udp.port == 53 |
| NTP | ntp |
| IPv6 only | ip.version == 6 |
| MAC address | eth.addr == aa:bb:cc:dd:ee:ff |
| Packet contains string | frame contains "password" |
| Regex on packet | frame matches "(?i)admin" |
| Large packets | frame.len > 1400 |
| Broadcast | eth.dst == ff:ff:ff:ff:ff:ff |
| Multicast | eth.dst[0] && 1 == 1 |
| Bad checksums | _ws.malformed or ip.checksum.status == 0 |
| Malformed packets | _ws.malformed |
| Exclude ARP noise | not arp |
Hands-On Lab Tutorials (Traffic You Generate Yourself)
These labs capture only traffic between your own machines or your own web requests — no production network is touched. Run them on a laptop, a lab VM, or a home router you administer.
Lab 1 — Capture and Read Your Own Web Traffic
- Start a capture on your active interface with capture filter
tcp port 80 or tcp port 443. - Open
http://example.comin a browser, wait 5 seconds, then stop the capture. - Apply
httpand inspect a GET request: expand HTTP → findUser-Agent,Host, and the request URI. - Right-click a request → Follow TCP Stream and read the full exchange.
- Note what you cannot see in the HTTPS requests (TLS Application Data) — then redo the lab with
SSLKEYLOGFILEto decrypt your own traffic.
Lab 2 — DNS Query Analysis
- Capture with filter
udp port 53. - Run
nslookup example.comandnslookup nonexistent-domain-xyz.example. - Filter
dns.flags.response == 1: find the A record in the first answer, and thercode 3(NXDOMAIN) in the second. - Use Statistics → DNS to see the full query table.
Lab 3 — ARP and DHCP in One Capture
- On a machine connected to a DHCP network, capture with
dhcp or arp. - Run
ipconfig /releasethenipconfig /renew(Windows) or restart the network service (Linux). - Watch the DORA exchange with
dhcp.option.dhcp, thenarpto see who-asks-who on the local segment.
Lab 4 — Diagnose a Slow Download
- Capture with
tcp port 443while downloading a large file from your own server (or a test file you control). - Apply
tcp.analysis.retransmissionand count events; thentcp.analysis.ack_rttfor latency. - Open Statistics → IO Graph with a “TCP retransmissions” filter layer to visualize loss over time.
pcapng with a descriptive name, add a comment (right-click → Packet Comment), and document each finding with its filter string — exactly as you would in a real engagement.Case Study (Training Lab Example)
Training Exercise: Protocol Anatomy via Authorized Test Captures
Context. During a training lab, students captured DNS, HTTP, and TCP traffic between authorized test systems to understand how protocols communicate. No production systems were involved; every packet was generated by student machines inside the isolated lab network.
Approach. Students applied capture filters (udp port 53, tcp port 80) to keep files small, then used display filters (dns.flags.response, http.request, tcp.flags.syn == 1) to isolate specific exchanges. Each student documented the three-way handshake, one DNS query/response pair, and one HTTP request/response with Follow Stream.
Findings. The exercise consistently surfaced three lessons: (1) capture filters dramatically reduce noise — unfiltered captures confused beginners; (2) the Info column plus the Details tree answer most questions without ever opening the raw bytes; (3) configuration issues (wrong DNS server, blocked HTTP port) became visible as concrete packet patterns rather than vague “it doesn’t work”.
Outcome. Students left with annotated captures they could explain field-by-field — the foundation for later SOC and malware-analysis modules.
Generic training illustration. Replace with your own dates, screenshots, and results.
The A7 Packet Analysis Framework
Our training method for turning raw captures into conclusions — the same discipline we teach SOC analysts:
Expert Commentary: A7 Security Hunters’ Perspective
“Students often ask for ‘the best filter’ — but filters are answers, not questions. The skill is asking what you need to learn, then choosing the filter that reveals it. A capture without a question is noise; a capture with a question is evidence. That is the difference between someone who clicks through packets and an analyst who concludes.”
— A7 Security Hunters, training team
Filters are documentation
Every finding you report should include the exact filter that produced it. A colleague — or an AI assistant — can then reproduce your analysis in seconds.
Learn the protocols before the tools
Wireshark is the best teacher of TCP/IP that exists. Students who dissect a handshake once never confuse SYN and ACK again.
Pair it with Nmap and Metasploit
Nmap finds the service, Metasploit validates it, and Wireshark proves what actually happened on the wire. The three tools complete each other — see our Nmap guide and Metasploit guide.
Research & Industry Context (Verified 2025 Figures)
Packet analysis sits at the heart of detection and response — and the data confirms why visibility matters more every year.
What this means for analysts: credential abuse and vulnerability exploitation both leave packet-level traces — authentication bursts, C2 beacons, and scanning patterns. Capturing, filtering, and correlating those traces is precisely what Wireshark-based workflows do, and it is a direct input to the automation that IBM found saves an average of $1.9M per breach.
50 Frequently Asked Questions
What is Wireshark used for?
Wireshark captures and analyzes network traffic to troubleshoot connectivity and performance issues, investigate security incidents, understand protocol behavior, and extract evidence from packet captures.
Is Wireshark free?
Yes. Wireshark is free, open-source (GPL) software for Windows, Linux, and macOS, including the GUI, TShark, and all protocol dissectors.
Is Wireshark legal to use?
Yes — it is standard professional software. Capture only traffic you are authorized to inspect: your own devices, networks you administer, or engagements with written scope.
What is a packet capture?
A packet capture is a recording of network frames as they crossed an interface, stored in formats like pcap or pcapng for later analysis.
What is the difference between capture filters and display filters?
Capture filters (BPF, e.g., tcp port 80) discard packets at capture time. Display filters (e.g., tcp.port == 80) only hide packets in the current view.
How do I filter by IP address in Wireshark?
Use ip.addr == 192.168.1.10 for either direction, ip.src == ... for source only, or ip.dst == ... for destination only.
How do I filter by port in Wireshark?
Use tcp.port == 443, udp.port == 53, or tcp.port in {80,443,8080} for multiple ports.
Why is my capture filter being rejected?
You are likely using display-filter syntax in the capture box. BPF syntax uses tcp port 80, not tcp.port == 80.
What does Follow TCP Stream do?
It reconstructs the full TCP conversation (all packets in one flow) into a readable stream, filtering out everything else — ideal for reading HTTP requests, responses, and file transfers.
How do I extract files from a capture?
File → Export Objects → choose a protocol (HTTP, SMB, TFTP) → select files → Save. This is a core malware-analysis and forensics workflow.
Can Wireshark see passwords?
It can see anything transmitted in cleartext — HTTP Basic auth, FTP, Telnet, unencrypted form fields. Encrypted protocols (HTTPS, SSH) hide passwords unless decryption keys are supplied.
Does Wireshark decrypt HTTPS?
Not by breaking TLS. It decrypts when you provide session keys via an SSLKEYLOGFILE (browsers/apps) or, for older RSA key exchange, the server private key.
What is SSLKEYLOGFILE?
An environment variable that makes supported applications (Firefox, Chrome, curl) write TLS session secrets to a file Wireshark can use to decrypt your own traffic for authorized analysis.
What is the three-way handshake?
The SYN → SYN-ACK → ACK exchange that opens a TCP connection. Filter tcp.flags.syn == 1 to see it; a RST instead of SYN-ACK means the port is closed.
What is a TCP retransmission?
When a segment isn’t acknowledged in time, TCP resends it. Filter tcp.analysis.retransmission — high counts indicate packet loss.
What is Expert Info in Wireshark?
Analyze → Expert Info summarizes anomalies Wireshark detected (errors, warnings, notes) with one click, filtering straight to suspicious packets.
How do I see only DNS queries?
dns.flags.response == 0 shows queries; dns.flags.response == 1 shows responses.
What does NXDOMAIN mean in a DNS capture?
It means the name doesn’t exist (DNS rcode 3). Filter dns.flags.rcode == 3; frequent NXDOMAIN can indicate typos, misconfiguration, or malware DGA beacons.
How do I analyze ARP traffic?
Filter arp, then split by opcode: arp.opcode == 1 (requests) and arp.opcode == 2 (replies). Many replies for one IP indicate spoofing.
How do I detect ARP spoofing in Wireshark?
Look for one IP claimed by multiple MACs (arp + Statistics → Endpoints), or excessive gratuitous ARP (arp.isgratuitous == 1).
How do I see DHCP exchanges?
Filter dhcp (older versions: bootp). The DORA sequence is Discover (1) → Offer (2) → Request (3) → ACK (5), filterable via dhcp.option.dhcp.
How do I filter HTTP requests in Wireshark?
http.request shows requests; http.request.method == "POST" narrows to POST; http.host == "example.com" narrows to a host.
How do I find a specific string in packets?
frame contains "password" searches raw bytes; frame matches "(?i)admin" adds regex with case-insensitivity.
What is TShark?
Wireshark’s command-line tool: tshark -r file.pcap -Y "http.request". Same dissectors, no GUI — built for scripting and servers.
Wireshark vs tcpdump — which should I use?
tcpdump for quick CLI capture on servers (tcpdump -i eth0 -w out.pcap); Wireshark for deep interactive analysis; TShark for automated analysis.
Why does Wireshark show checksum errors on my traffic?
TCP/UDP checksum offloading computes checksums in hardware after capture. Disable validation in Preferences → Protocols → TCP/UDP, or ignore if consistent.
How do I capture Wi-Fi traffic?
Normal Wi-Fi captures only see your own adapter’s traffic. Monitor mode (adapter-dependent) captures nearby frames; alternatively capture on the access point or router you administer.
How do I capture traffic on a remote server?
Run tcpdump/TShark there and transfer the pcap, or use SSH remote capture (Wireshark’s “Capture → Options → Manage Interfaces” supports SSH).
What is promiscuous mode?
It makes the NIC capture all frames on the segment, not just its own traffic. Needed for switch-SPAN/tap analysis; not a way to bypass network segmentation.
How do I reduce capture file size?
Use capture filters, limit packets per file and use ring buffers (Capture Options), or trim later with editcap.
What is pcapng vs pcap?
pcapng is the modern default format with per-interface metadata, comments, and multiple interfaces; pcap is the older classic format. Wireshark reads both.
How do I measure latency with Wireshark?
Filter tcp.analysis.ack_rtt — each matching packet shows the round-trip time of that segment in the Details pane.
How do I see all conversations?
Statistics → Conversations (or Endpoints) lists every TCP/UDP conversation with packet counts, bytes, and start/stop times.
What is an IO Graph?
Statistics → IO Graph plots packets or bytes over time, with filter layers — ideal for visualizing retransmission storms, beaconing, or traffic bursts.
What are coloring rules?
Rules that color packets by criteria (protocol, error flags, conversation). View → Coloring Rules to customize; built-ins already highlight TCP problems.
What are Wireshark profiles?
Saved configurations of preferences, coloring rules, and filters (Edit → Configuration Profiles) — e.g., separate profiles for general analysis, DNS, and malware hunting.
How do I save a filtered subset of packets?
Apply a display filter, then File → Export Specified Packets and choose “Displayed” — the exported file contains only visible packets.
How do I comment on packets?
Right-click a packet → Packet Comment (pcapng only). Comments persist in the file and document your analysis for the report.
Can Wireshark analyze VoIP or video?
Yes — Statistics → VoIP Calls, RTP streams, and Telephony menus analyze SIP/RTP/RTCP traffic including jitter and loss metrics.
How do I detect malware traffic in Wireshark?
Look for beaconing (regular periodic connections — visible in IO Graph), long random DNS names, unusual ports, and non-browser user agents; extract objects and hash them.
What is a beacon in traffic analysis?
A regular, periodic connection pattern (e.g., every 60 seconds) that malware uses to phone home. IO Graphs and endpoint timestamps reveal it.
What is DNS tunneling?
Encoding data inside DNS queries/responses to exfiltrate or communicate. Indicators: high DNS volume, long subdomain labels, TXT records with encoded payloads.
How do I detect port scans in Wireshark?
Many SYN packets (tcp.flags.syn == 1) to many ports from one source in a short window, followed by RST/ACK — filter and check the Endpoints table.
How do I find my own IP in a capture?
Check the source addresses of your outbound packets, or use Statistics → Endpoints and look for the address repeated across many conversations.
What does “Malformed packet” mean?
Wireshark couldn’t fully decode a packet — the dissector found invalid structure (_ws.malformed). It can indicate bugs, fragmentation, or intentionally broken traffic.
Why are timestamps different from the real time?
Check View → Time Display Format. Captures store relative or epoch times; wall-clock accuracy depends on the capture machine’s clock sync (NTP).
Is Wireshark good for learning networking?
It is arguably the best teaching tool for TCP/IP: watch real handshakes, DNS flows, and HTTP exchanges instead of reading about them. Every A7 course uses it in week one.
What certifications cover Wireshark?
Wireshark appears across Network+ (CompTIA), CCNA, Security+, eCIR, GIAC GCIA, and SOC-analyst programs. The Wireshark Certified Network Analyst (WCNA) is the dedicated credential.
Where can I practice Wireshark safely?
Capture your own traffic, download sample pcaps from the Wireshark wiki and malware-traffic-analysis.net, or run labs in isolated VMs. Never capture on networks without authorization.
How do Wireshark, Nmap, and Metasploit work together?
Nmap discovers services, Metasploit validates vulnerabilities, and Wireshark proves what happened on the wire — see our Nmap guide and Metasploit guide for the full workflow.
Related Guides from A7 Security Hunters
Packet analysis completes the core toolset. Continue building your skills with the rest of the cluster:
Nmap Commands — The Complete Guide
Discover hosts, ports, services, and OS fingerprints before you capture a single packet.
Metasploit Commands — The Complete Guide
Validate vulnerabilities in authorized labs; use Wireshark to confirm what your sessions actually did.
Coming soon
Burp Suite Guide · SQLMap Tutorial · Hydra Commands · Netcat Commands · Linux Commands for Security Professionals · SOC Analyst Course.
References & Authoritative Sources
Downloads, documentation, and the official Wireshark user guide.
Official reference for the interface, capture options, and analysis features.
Complete CLI reference for capture and display filtering from the terminal.
BPF capture-filter reference with examples for dozens of protocols.
Field-based display-filter syntax, operators, and protocol field references.
Authoritative BPF syntax and capture examples for the CLI twin.
Official guidance on SSLKEYLOGFILE and private-key decryption workflows.
Practice pcaps and write-ups for malware traffic analysis training.
Long-standing textbook on Wireshark-based troubleshooting and analysis.
Credential abuse 22% and vulnerability exploitation 20% of initial access vectors; ransomware in 44% of breaches.
Global average breach cost $4.44M; ~$1.9M average savings with extensive AI and automation.
Technique IDs (e.g., T1046 Network Service Scanning, T1071 Application Layer Protocol) for mapping findings to attacker behavior.
© A7 Security Hunters. Educational content — capture and analyze only traffic you own or are explicitly authorized to inspect. Last updated: August 2026.